
FY2024 GHG Inventory Update
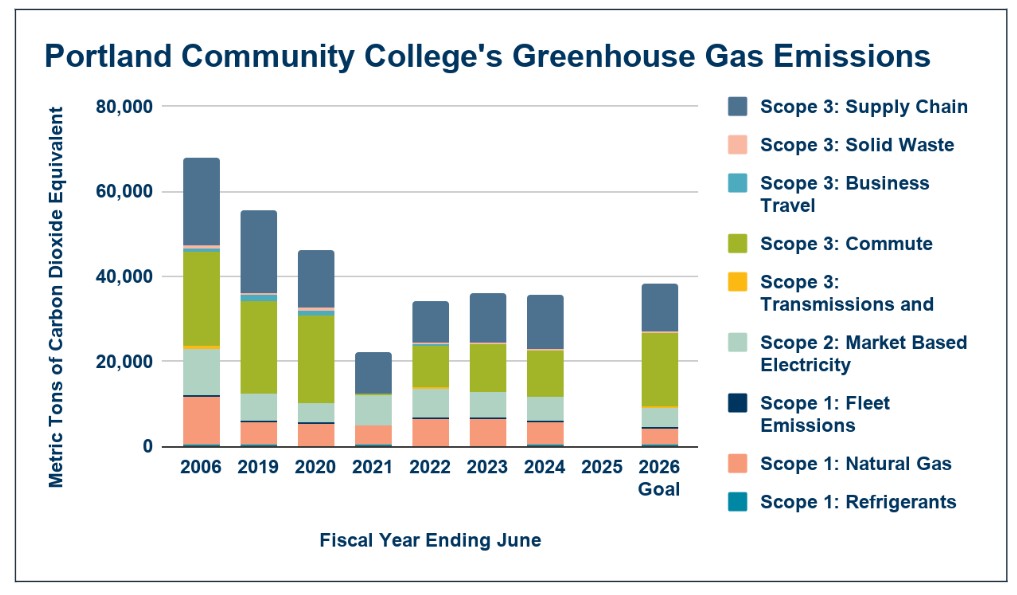
Bar graph showing the reduction of greenhouse emissions at PCC since signing Second Nature’s Climate Commitment in 2006. PCC runs on a July-June fiscal year and displays the following emissions categories: supply chain, commute, T&D loss, solid waste, business travel, electricity, refrigerants, stationary fuels, natural gas, and fleet (biogenic and anthropogenic). Further details can be found in the text of this page.
Since our baseline reporting year ending Fiscal Year June 2006, the college hasreduced its annual emissions by 30,365 metric tons of carbon dioxide equivalent (MTCO2E), or approximately 52%.
This is the equivalent of the energy use for 6,328 homes in the United States for one year.
Overview
The Portland Community College (PCC) Sustainability Department completes an provisional annual greenhouse gas (GHG) inventory to monitor our institution’s progress towards meeting our GHG reduction targets as outlined in PCC’s 2021 Climate Action Plan: Resiliency, Equity and Education for a Just Transition. Due to a lag in the release of the latest market based emissions factors for electric utilities, the final updates can not be filed until as much as two-three years following the initial report. This provisional report also reflects much needed updates to other emissions factors, which were vetted through our consulting firm, Good Company in April of 2024. This report uses market-based utility factors released in November of 2024, which set market-based utility factors for Oregon Utilities through 2023.
PCC’s 2021 Climate Action Plan update set a new target date of 2040 for Carbon Neutrality from Scope 1 & 2 emissions. Using science-based targets as the model for reduction, PCC took the available information on the college’s emissions and aligned the reduction targets so that PCC’s contribution to limiting global warming would not exceed 1.5°C. In support of equitable climate action, PCC’s Climate Action Plan determined that the college must work to limit climate change contributions in alignment with a global need for GHG emissions not to exceed 1.5°C, which is the threshold scientists have identified to protect many low-lying and island nations from disastrous sea level rise.
In addition to setting new carbon neutrality targets, the plan outlines five-year goals to be met in the areas of all Scope 1 and 2 GHG emissions, currently tracked Scope 3 GHG emissions, education and outreach and resiliency. Equity and climate justice are embedded throughout PCC’s Climate Action Plan.
About PCC’s Greenhouse Gas Emissions
At PCC, greenhouse gas emissions are influenced by student and educational needs, building and systems design, fuel choices, operational efficiency, and individual behaviors such as purchasing and commuting choices. We look at our emissions in terms of the amount of direct influence we have and divide them by scope accordingly.
Scope 1 & 2 emissions chiefly consist of emissions from heating and lighting buildings and running electrical equipment. It is also where PCC has the greatest opportunity to influence change, through green building design and improvements in operations, energy efficiency, and education and outreach.
Scope 3 emissions are more challenging to both measure and influence. They include emissions from commuting to the college by both staff and employees, college purchases of goods and services and from business travel. Because of their indirect nature, both supply chain emissions and commuting emissions have unique challenges both in terms of measuring change and creating. However, both of these areas are places where PCC’s mission vision and values are reflected in how PCC does business. By taking a holistic approach to sustainability, PCC works to ensure that our community has better opportunities for financial and personal health.
Greenhouse Gas Emissions Inventory
Highlights – Operating Buildings and Grounds (Scope 1 & 2)
- Since PCC’s baseline year of FY 2006, the college has reduced its greenhouse emissions at PCC from operating Buildings and Grounds (Scope 1 & 2 emissions) by about 45% per square foot with a net emissions of 11,729 Metric Tons, a net improvement of approximately8% since over the previous reporting year FY 2023.
- In FY 2024, the college purchased and produced a combined total of about 14,777,771 kWh of renewable solar or wind energy, which avoided about 4,684 MTCO2E of greenhouse gas emissions due to subscriptions to Portland General Electric’s Renewable Energy Credit programs: Green Future Enterprise and Green Future Impact as well as Oregon Shine’s Community Solar program and its own onsite solar arrays.
- The college received over $15,335 in utility bill credits from the Community Solar program in FY 2024.
- Overall, PCC has become more energy efficient by decreasing total building energy consumption use per square foot by about 48% since FY 2006. The fine tuning of our energy systems and use of the Strategic Energy Management Program have continued to help improve our energy efficiency; however, an increase in the operating hours and outside air due as a response to COVID-19 contributed greatly to an increase in the use of both electricity and natural gas, which reduced the college’s energy savings in FY 2024.
- Continued investment in energy efficiency projects will reduce electricity and natural gas consumption throughout the district. Upcoming bond measure projects with significant potential to reduce PCC’s greenhouse gas contributions include remodels to the other side of the Health Technology Building, the Communication Technology Building on the Sylvania Campus and Building 3 on the Rock Creek campus. In addition, PCC is working to retro-commission the Cascade Student Services Building. Operationally, the college is also working on strategic scheduling to help fine tune the college’s energy systems, which will further PCC’s climate action goals, while saving the college a significant amount of money.
Highlights – Travel, Commuting, Purchasing, and Solid Waste (Scope 3 Emissions)
The largest contributor to Scope 3 emissions in FY 2024 were supply chain emissions, which made up about 35% of the college’s greenhouse gas emissions, while emissions from commuting made up the majority of the remainder of emissions at around 30%. Business travel and solid waste combined made up less than 2% of the remaining Scope 3 emissions.
The college delayed its transportation modality survey for students from the fall of FY 2023 to the spring of FY 2024. In FY 2023, PCC began using a shortened number of days for employee commuting based on the FY employee survey, this was due to a reduction in normal operations; however PCC was open fully for classes in FY 2024 and the emissions estimates reflect this. In addition, new methods are being used to count students. PCC has adopted the IPEDS FTE for the numbers of students at the college, rather than Oregon FTE. This may be a little low; however, it is still likely that students are travelling to campus less than reported due to an increase overall in remote learning since the pandemic.
Purchasing and waste habits also impact Scope 3 emissions. The Sustainability Department is working closely with the Purchasing Department and other college buyers to advance sustainable purchasing practices. While we saw a reduction in waste-related emissions, it’s important to recognize that more students are taking courses on-line and overall enrollment is down. In turn, student-facing areas such as Dining Services are likely to have reduced on-campus waste.
Future Greenhouse Gas Emissions Reduction
The college is working on a wide variety of initiatives to reduce its greenhouse gas footprint. Many of these efforts are outlined in PCC’s 2021 Climate Action Plan: Resiliency, Equity and Education for a Just Transition and Sustainability Leadership Council annual work plans. If you would like to learn more or are interested in getting involved, please email us at sustainability@pcc.edu.