GHG Inventory Update FY 2018
Overview
The Portland Community College Sustainability Department completes an annual greenhouse gas (GHG) inventory to monitor our institution’s progress toward meeting our GHG reduction targets as outlined in the Climate Action Plan. PCC’s goals are to:
- Reduce greenhouse gas emissions to 40% below 2006 levels by 2030; and
- Reduce greenhouse gas emissions to 80% below 2006 by 2050
PCC’s greenhouse gas emissions are influenced by student and educational needs, staff commuting behavior, electronics use, operational efficiency, building design, utility choices, and purchasing behavior. We look at our emissions in terms of the amount of direct influence we have and divide them by scope accordingly. Our Scope I & II emissions chiefly consist of emissions from heating and lighting buildings and running electrical equipment and are where PCC has the greatest opportunity to influence change, through green building design and improvements in operations, energy efficiency, and education and outreach.
Our Scope III emissions are more difficult to both measure and influence. They include emissions from commuting to the college by both staff and employees, college purchases of goods and services, and business travel. Both supply chain emissions and commuting emissions have unique challenges in terms of measuring change. While we have undertaken many significant projects to reduce the emissions from our supply chain through greener purchasing, supply chain emissions are chiefly measured by spending and it is difficult to separate green spending from non-green spending at this time. Furthermore, commuting emissions tend to fluctuate with student enrollment and while significant commuters utilize alternative transportation, the sheer number of people commuting to campus each day overshadows this.
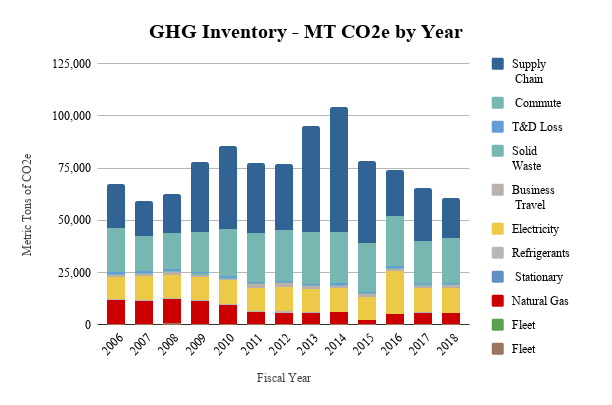
Greenhouse Gas Emissions
Between 2006 and 2018, PCC reduced overall greenhouse gas emissions by nearly 10%, with emissions of 60,841 metric tons of CO equivalent (MTCO2E) in 2018, compared to 67,378 in 2006. Infrastructure investment and energy efficiency campaigns have had significant positive results, although those results continue to battle overall college growth.
Our total emissions reduction since 2006 is 6,567 metric tons of CO2e. According to the USEPA Greenhouse Gas Equivalencies calculator, this is equivalent to greenhouse gas savings from removing approximately 1,394 passenger vehicles from the road OR the equivalent carbon sequestered by 7,742 acres of US Forests in one year. For a point of comparison, the Opal Creek Wilderness area measures 20,746 acres.
Scope I and II Emissions
Scope I and II emissions, which account for energy consumption, have seen a significant reduction of 21.8% or 4,939 metric tons of CO2e. These emissions include natural gas consumption, on-site fuel usage (such as diesel), purchased electricity, and transfer and distribution (T&D) loss. PCC’s 2030 objective is to reduce our electrical consumption by 50% per square foot below 2006 levels and we are on target to meet that goal. PCC has so far decreased its electrical consumption per square foot by 18% over 2006 levels. Overall, we’ve decreased our total building energy consumption use per square foot by 49%. This decrease in energy consumption is impressive, as the college has increased its square footage by 32% since 2006 and enrollment has increased by approximately 10%. PCC’s investment in LEED-certified green buildings, lighting upgrades, and behavior change programs have helped to reduce energy use and climate change impacts.
Scope III Emissions
Overall Scope III emissions make up the largest share of PCC’s emissions at 71%. Scope III emissions have dropped by 6.7% over 2006 levels. Scope III emissions are tied to our enrollment levels as they are based on our spending patterns and student commuting patterns. Some of the reasons for this drop include declines in enrollment and improvements in data analysis.
The largest contributor to scope III is commuting emissions from staff and students traveling to and from campus, which make up about 33.9% of the emissions. Emissions from the supply chain, which include all of the products and services PCC purchases, make up 30.9%. Business travel comes in third and is relatively small at around 3.3%. The college has also taken on significant initiatives to help address these sources of emissions. For example, providing options for students to green their commute to school includes providing inter-campus shuttles, offering subsidized bus passes to students, supporting public transportation to our facilities, and using grants to promote active transportation such as bicycling and walking. We are also working closely with the Purchasing Department and other college buyers to advance sustainable purchasing practices.
Conclusion
PCC has a strong commitment to sustainability and climate action. The college is working on a wide variety of initiatives to reduce our greenhouse gas footprint, and to date has seen a 10% reduction in total greenhouse gas emissions since 2006. Many of these efforts are outlined in the Climate Action Plan and Sustainability Leadership Council annual work plans. If you would like to learn more or are interested in getting involved, email sustainability@pcc.edu.