Why we are committed to YESS

The real cost of education: bridging opportunity gaps
PCC is the most relied upon institution in Oregon for providing pathways to learning and a rewarding career. Because of PCC, people are changing their lives and achieving their dreams. But too many students do not complete their education. Across the nation at community colleges like PCC, student success is not satisfactory and it is not equitable. After three years at PCC:
- 22% of students complete their degree or certificate
- 20% of students transfer with no PCC credential
- 18% of students have yet to complete their studies
- 40% of students no longer attend college anywhere
Students who enroll in classes at our institution plan to complete those courses and often a certificate or transfer degree. Non-completion is not a reflection of a lack of desire or effort, but rather a sign that our systems are not supporting all students.
Outcome disparities are clear in the completion rates of what are known as “gateway courses” or foundational entry-level classes. Gateway courses are some of our highest enrolling classes at PCC, yet the completion rates are disproportionately low for some historically marginalized student populations.
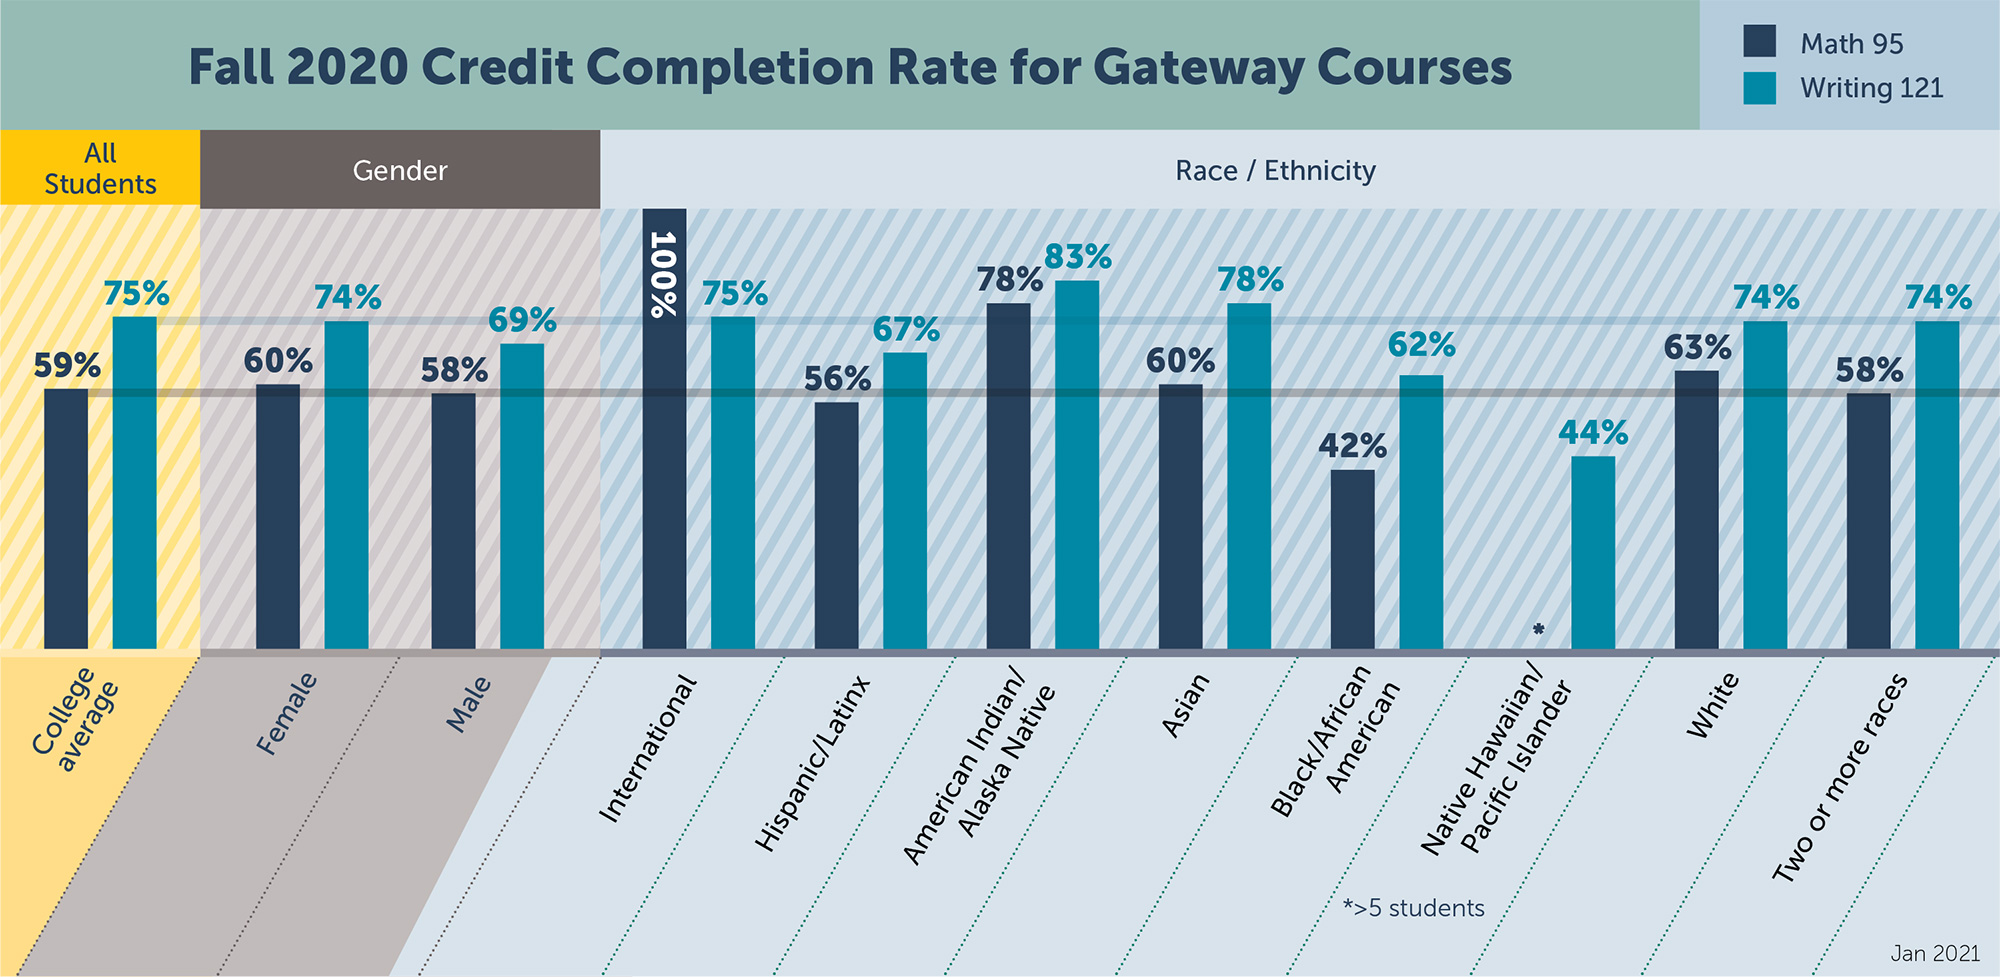
View full-sized gateway courses graphic »
See text description of gateway courses graphic
| Group | Math 95 | Writing 121 |
|---|---|---|
| All students – college average | 59% | 75% |
| Gender – Female | 60% | 74% |
| Gender – Male | 58% | 69% |
| Race/ethnicity – International | 100% | 75% |
| Race/ethnicity – Hispanic/Latinx | 56% | 67% |
| Race/ethnicity – American Indian/Alaska Native | 78% | 83% |
| Race/ethnicity – Asian | 60% | 78% |
| Race/ethnicity – Black/African American | 42% | 62% |
| Race/ethnicity – Native Hawaiian/Pacific Islander | No data, less than 5 students | 44% |
| Race/ethnicity – White | 63% | 74% |
| Race/ethnicity – Two or more races | 58% | 74% |
The cost of systemic equity gaps is clear in disproportionate completion rates and the extra costs required for students to complete their educational journeys.
$123 per credit*
A student enrolled with 12 credits pays $1,476 for tuition.
*2020 tuition. See current tuition and fees.
78.9%
78.9% was the Fall 2019 successful credit completion rate.
$157 per completed credit
If a student pays for 12 credits but only successfully completes 9.4 credits (78.9% completion), that’s $157 per completed credit.
| By race/ethnicity | Successful credit completion | Cost per completed credit |
|---|---|---|
| American Indian / Alaska Native | 71.95% | $171 |
| Asian | 83.75% | $147 |
| Black or African American | 67.8% | $181 |
| Hispanic or Latino | 75.2% | $164 |
| Native Hawaiian / Pacific Islander | 71.5% | $172 |
| Two or more races | 77.6% | $159 |
| Not reported | 78.7% | $156 |
| White | 80.2% | $153 |
Why education and completion matter
A college education is a gateway to better employment and economic stability. According to 2019 census data, students who earn a four-year degree in the Portland region earn a median of $60,441, compared with $34,322 for those who completed a high school diploma or GED.
| Educational attainment | Unemployment rate (%) | Median weekly earnings ($) |
|---|---|---|
| Master’s degree | 2.1% | $1,434 |
| Bachelor’s degree | 2.2% | $1,198 |
| Associate’s degree | 2.8% | $862 |
| Some college, no degree | 3.7% | $802 |
| High school diploma | 4.1% | $730 |
| Less than a high school diploma | 5.6% | $553 |
| Note: Data are for persons age 25 and over. Earnings are for full-time wage and salary workers. Source: U.S. Bureau of Labor Statistics, Current Population Survey. |
||
Student success can mean personal achievement and empowerment, but it is also about gaining transferable skills to compete in the job market and creating opportunities for economic growth for one’s family and our communities.
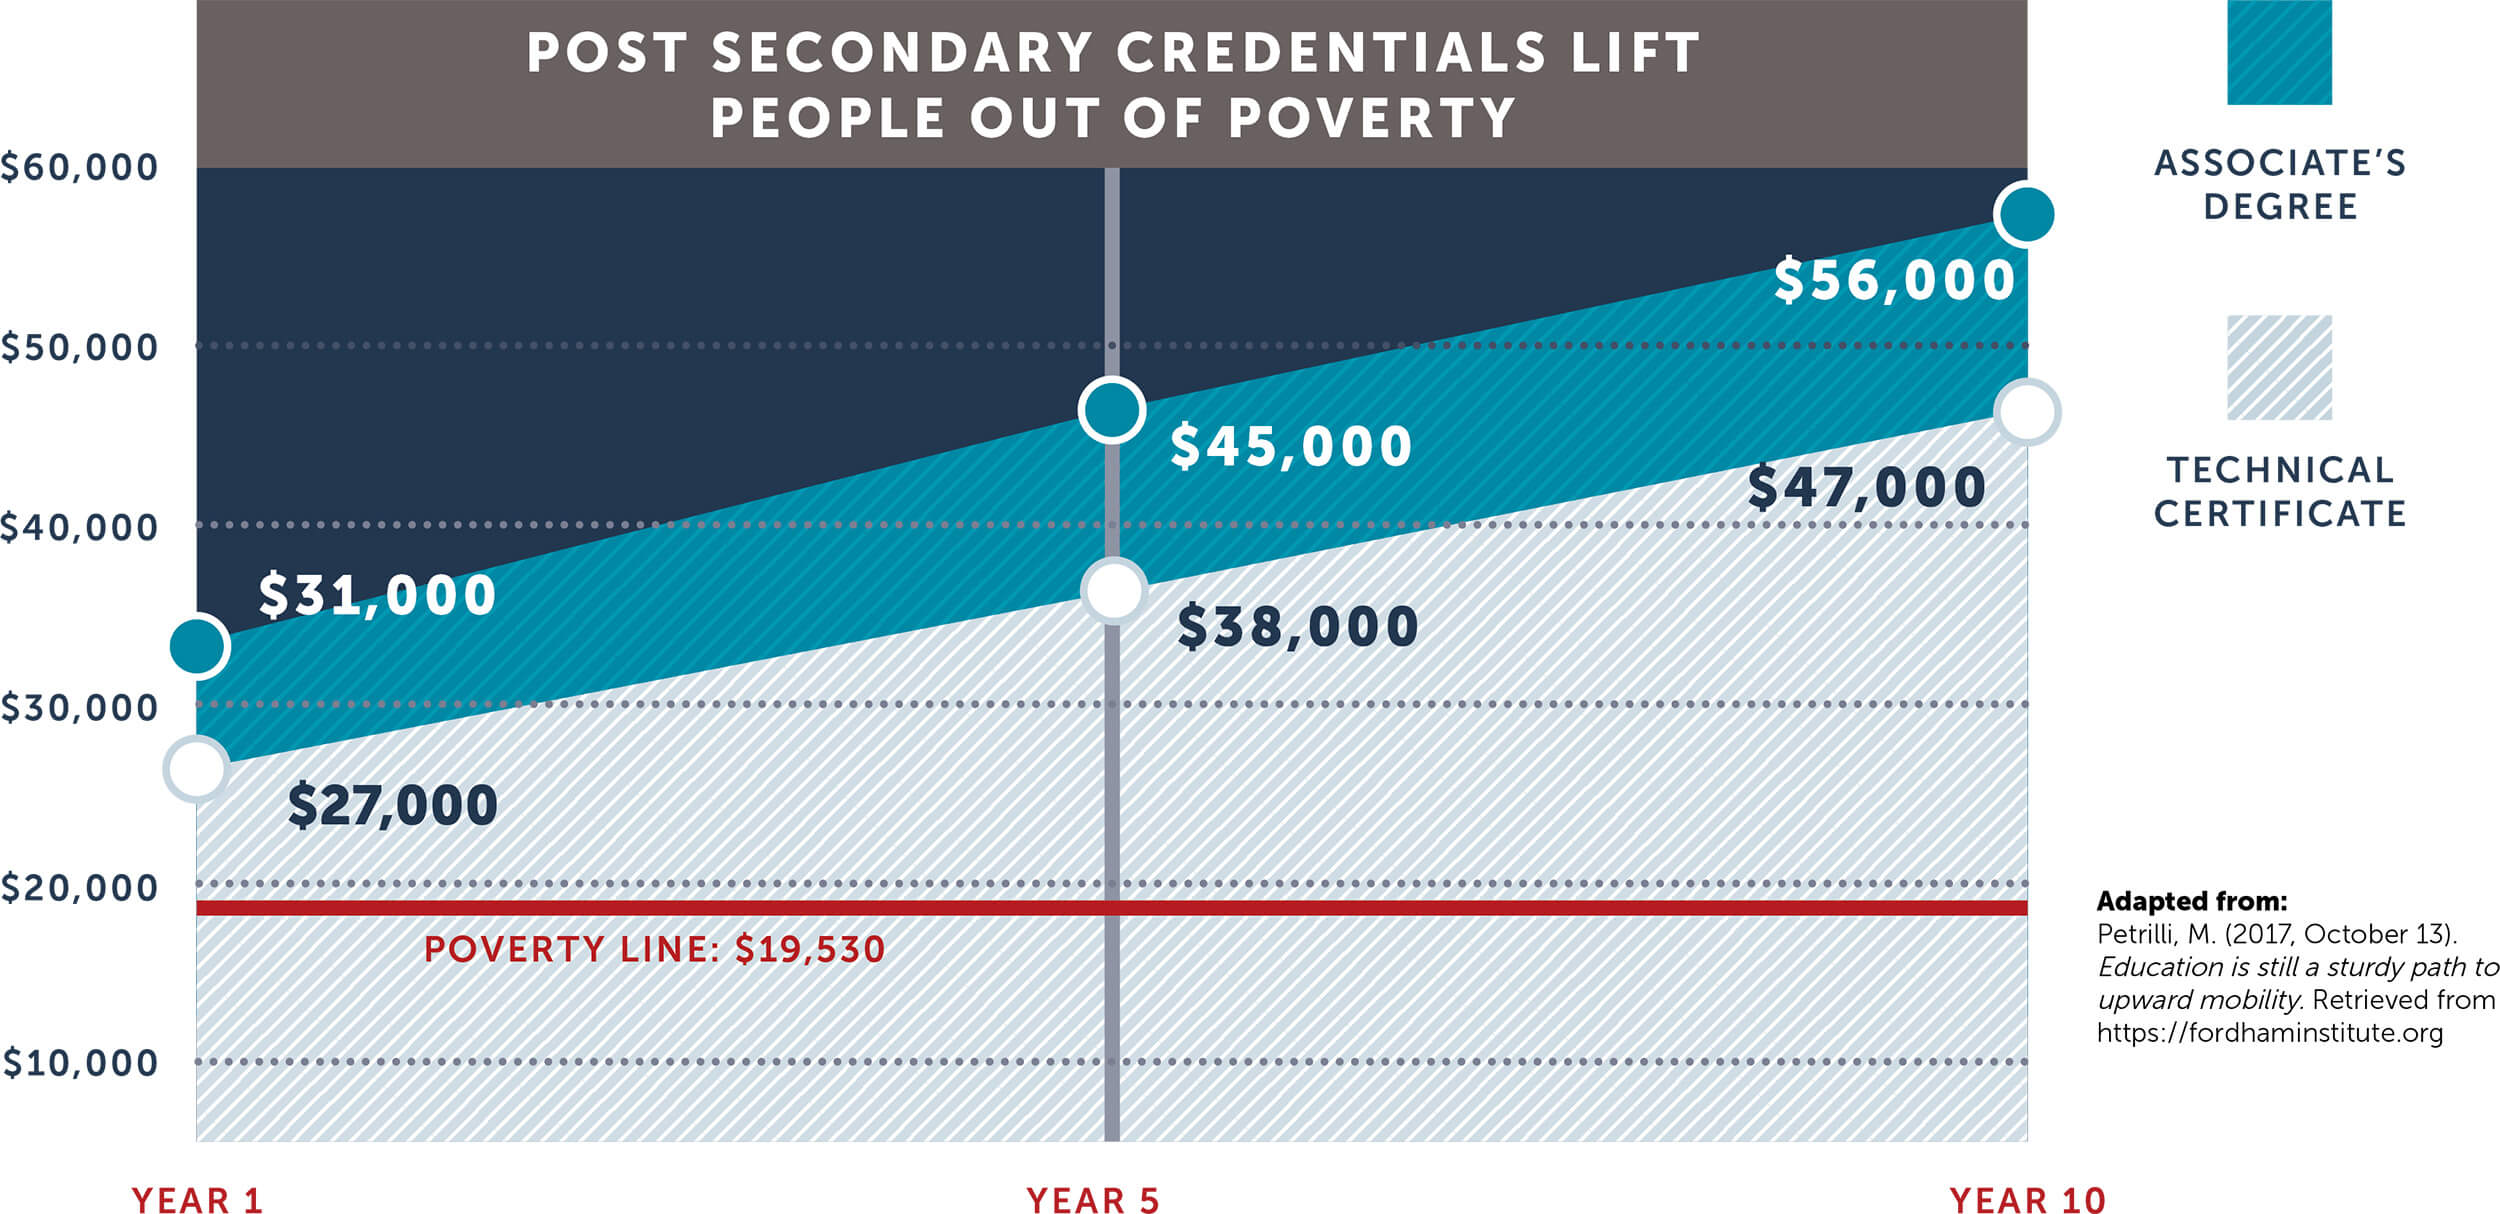
View full-sized poverty graphic »
See text description of poverty graphic
- Post-secondary credentials lift people out of poverty.
- Poverty line: $19,530
- Year 1:
- Someone with a technical certificate can expect to earn $27,000.
- Someone with an associate’s degree can expect to earn $31,000.
- Year 5:
- Someone with a technical certificate can expect to earn $38,000.
- Someone with an associate’s degree can expect to earn $45,000.
- Year 10:
- Someone with a technical certificate can expect to earn $47,000.
- Someone with an associate’s degree can expect to earn $56,000.
- Adapted from Petrilli, M. (2017, October 13). Education is still a sturdy path to upward mobility. Retrieved from https://fordhaminstitute.org.