GHG Inventory Update FY 2013
 Since FY06, PCC’s overall GHG emissions have increased by 53%, from 62,555 MT CO2e in FY06 to 95,874 MT CO2e in FY13. It is important to put these numbers in context. A great deal of this increase can be attributed to emissions related to Bond construction and materials. However, emissions from PCC’s internal operations (Scope I & II) have decreased 25.6% since FY06. This can be attributed to new boilers being installed on the Sylvania campus as well as retrofits being completed throughout the district, LEED certified buildings, and solar panels at the Rock Creek campus, Newberg Center, and Willow Creek Opportunity Center.
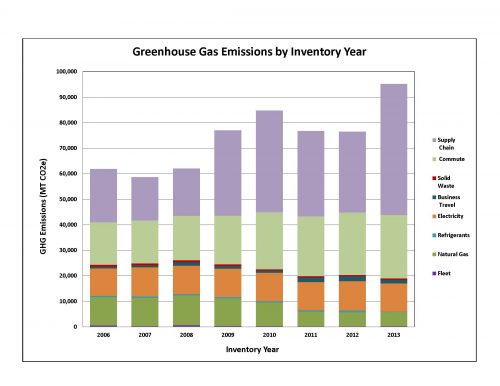
In fact, energy usage has decreased by 90,123 MMBtu. With the dramatic increase in enrollment and addition of 372,962 square feet in building area between FY06-FY13, this is truly remarkable. As a comparison, Lane Community College with 14,661 FTE has an energy use intensity (EUI) of 0.102 MMBTU/ ft² for the 2011-2012 year, while PCC currently has a 0.076 MMBTU/ ft² EUI and is at 38,088 FTE.
PCC has been working to achieve a GHG emissions reduction goal of 40% below 2006 emissions by 2030. In order to reach this goal, as well as others outlined in PCC’s Climate Action Plan, the PCC Sustainability Leadership Team (SLT) meets consistently to strategize around the goals and action items in the most recently completed Climate Action Plan.