Learn about statistical tools in D2L Brightspace
Why use Statistics?
80% of teachers feel that student progress can be effectively tracked using data and a majority of them believe data and digital tools improve student learning and make them better teachers.
(free images from Pixabay)
Teachers Know Best: Making Data Work for Teachers and Students, Bill & Melinda Gates Foundation 2015
In order to inform class instruction on a day to day basis, instructors need to identify whether students are meeting the learning outcomes. Gathering this information requires continuous assessments and monitoring of student progress. In order for schools to identify attainment of priority goals, they need to collect achievement data. Learning management systems (LMS) often provide statistical tools that can easily monitor student achievement of learning goals.
The only way teachers and schools can identify which students demonstrate proficiency on the course learning outcomes is to continuously assess and monitor students as part of their class instruction. Teachers must know on a day to day basis where their students are in relation to the content standards to have the necessary information to inform instruction. Schools have to identify the student achievement data they need to collect to determine if they are making progress toward the attainment of their priority goals.
Where do we find statistic tools to track student progress?
D2L Brightspace has an excellent built-in statistical tools that we can use as a instructors to provide us with a snapshot of where students are at any given time. This blog will list all available tools within the following Brightspace instructional tools: Content, Discussions, Quizzes, Rubrics, Classlist, Grades, and Class Progress.
I. Content
A. Completion Summary
Located inside each of the topic in the Content area, you can view completion summary and find out who has view that particular content topic.
View completion tracking results for a topic
- From the Content, click on the Module and click the topic you want to view completion tracking results for.
- On the topic page, click the Completion Summary tab (located below the topic).
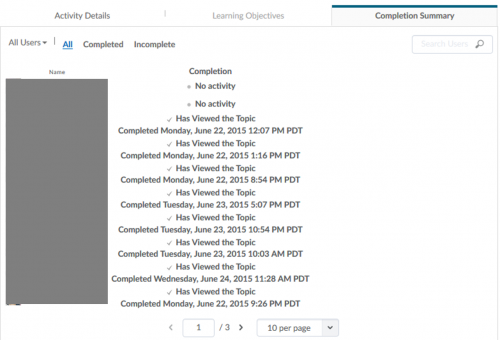
The Completion Summary shows each user’s progress for the topic in a table format. The Completion Summary is located within a topic, below its content.
Each topic contains a Completion Summary that tracks student completion results.
The types of completion results depend on the type of topic. For example, completion tracking results for a assignment folder indicate whether a student has submitted anything, while results for a file topic indicate whether a student has viewed the topic or not.
In addition to the existing “Completed” and “Incomplete” filters, you can also filter users in the Completion Summary by the groups or sections you created within your course.
B. View Reports
You can find a more detailed statistics through the Table of Contents. Want to know how many users have visited the topic and time spent? You can also get a detail report of each student, when they last visited the content, how many times they visited, total time spent and average time spent, which can be done via Class Progress too (see below).
- From the Content, click Table to Contents.
- Click View Reports from Related Tools drop-down list.
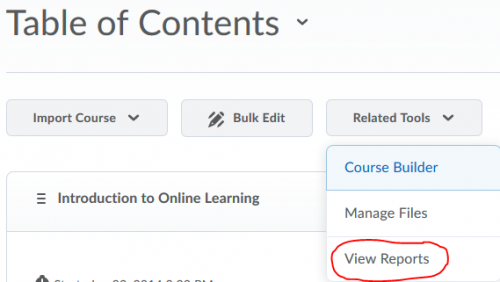
- Click on the number under Users Visited, next to each topic listed below to view more detail information.

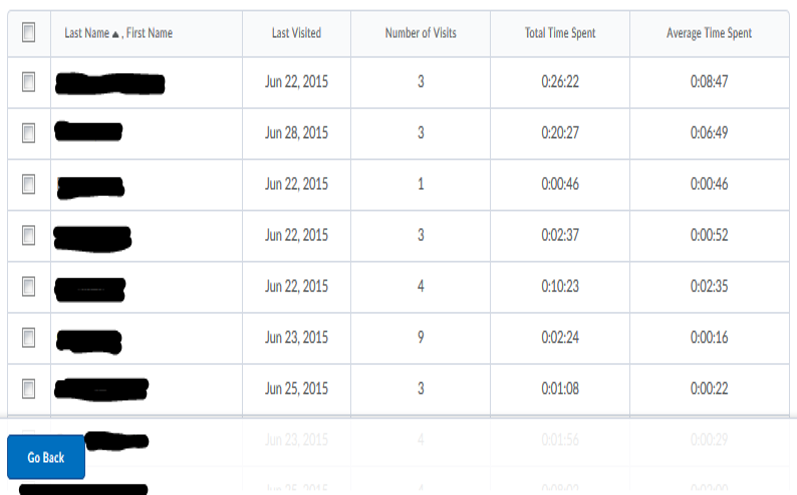
- Here’s a detail view of each student
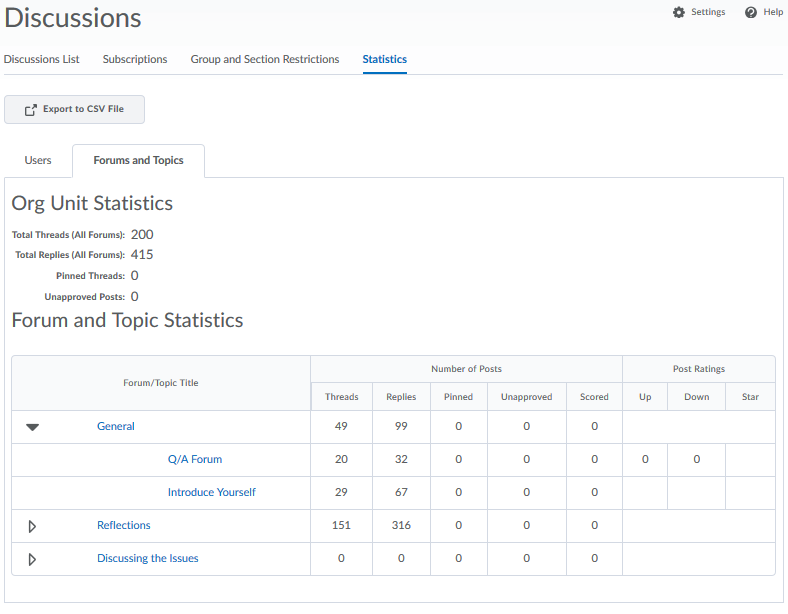
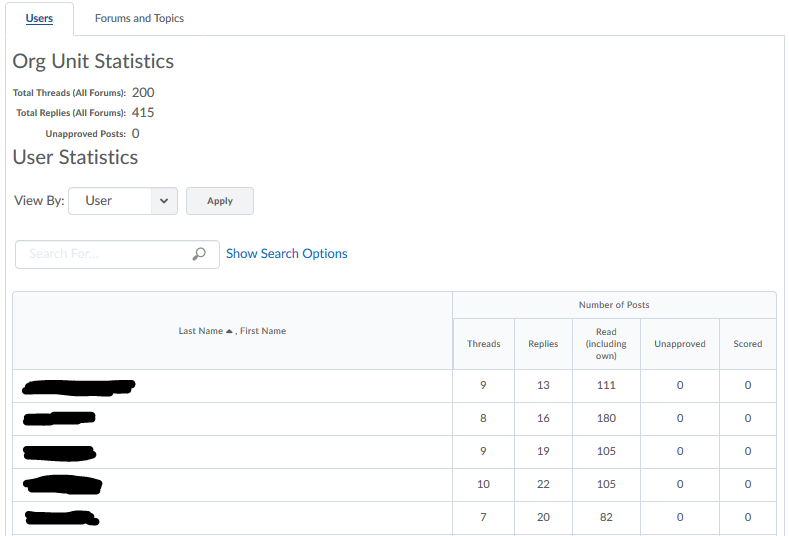
II. Discussions
You can view by users or by Forums and Topics or overall course statistics. If viewing by users, you can find out how many threads and replies each student did and how many posts they have read including their own.
- From Discussions, click on Statistics.
- View by Users or by Forums and Topics.
III. Quizzes
View statistic in detail for each of your quiz or exam, based on the user stats, question stats, or question details. Review the questions in class for any questions which students had answered the most wrong answers.
- From Quizzes, click on Statistics.
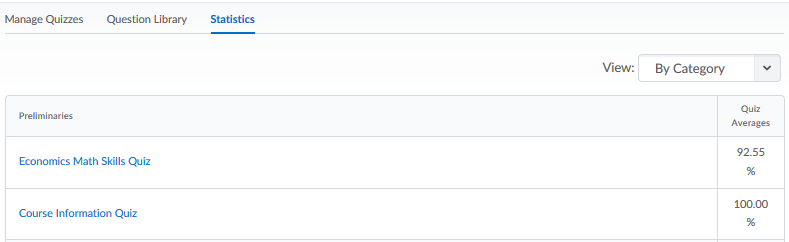
- Click on the Quiz name to view detail information. You can view by user stats, question stats, or question details.

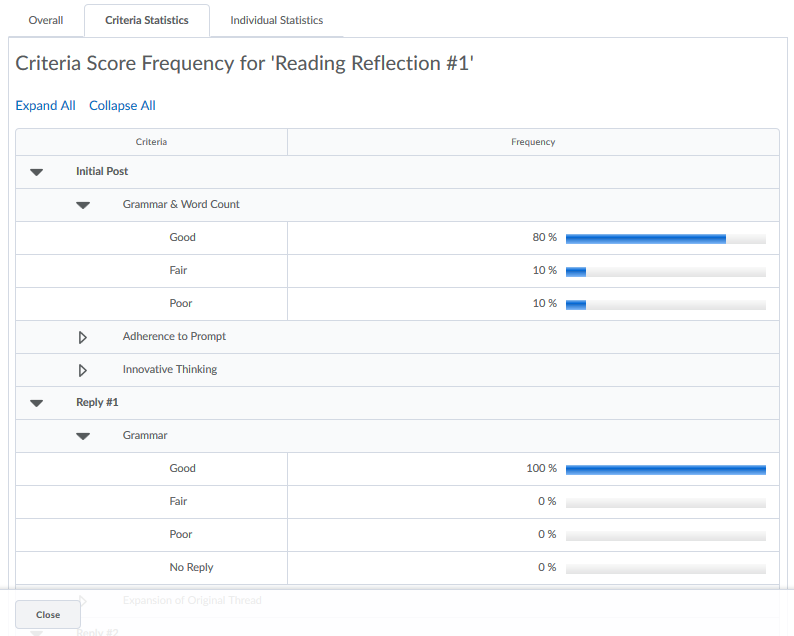
IV. Rubrics
The Rubric tool allows you to evaluate based upon a predefined set of criteria to grade fairly and consistently. You can view overall, criteria, and individual statistics.
- From the Course Admin, click on Rubrics.
- Click on View Statistics from the rubric drop-down list
- Click the Statistics icon under Actions next to which activity you want to view the rubric statistic
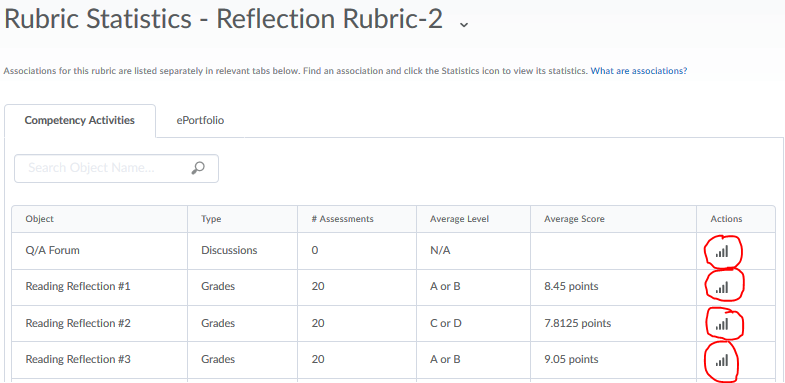
- View based on overall, criteria statistics, or individual statistics
V. Grades
You can view learners’ class and user statistics.
- From Grades, click Statistics from the grade item drop-down list
- You can sort between viewing class statistics or user statistics
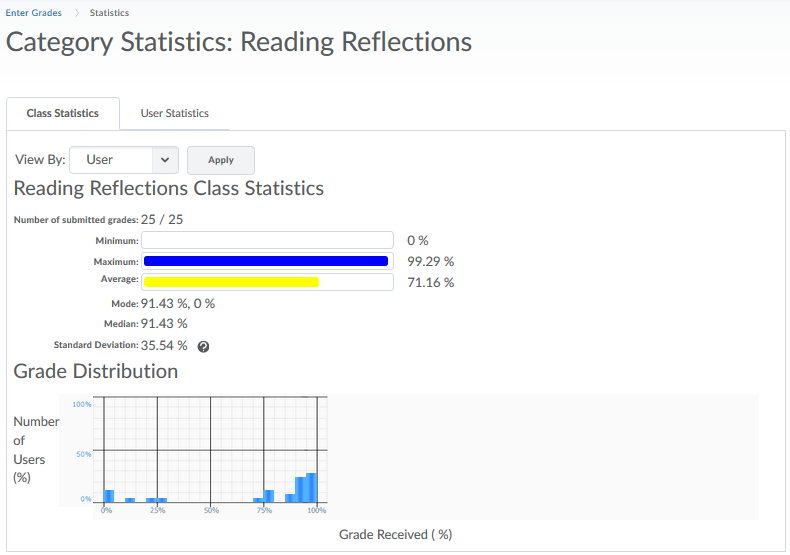
This view allows you to see how much variance there is within specific graded activities. This information can help you assess either how well the students are doing or help you identify any activities that may need reworking.
VI. Class Progress
The class progress tool helps track class and user progress in a course by providing statistics across a variety of tools. You can view users’ progress and user statistics.
- From Course Admin, click on Class Progress

- Click on the student’s name to view detail user progress of the student. You can then choose which activity or tool you want to see in detail.
Learn more about Class Progress:
- Use and modify the class progress report (video tutorial)
- Understand and modify the class progress page (video tutorial)