Student Success 2024-25 Summary Dashboard
The Student Success Summary is a visual overview of key metrics from ten Student Success Reports. It highlights year to year directional changes, highest and lowest values and the range for each metric for 2020-21 through 2024-25. Please note that while high and low points are identified, the difference between them may be small. For details including disaggregated findings and equity gap analyses, see the individual Student Success Reports.
2024-25 Key Takeaways
-
- Credit completion rates and most highest enrolling course completion rates are above all *previous levels.
- Fall-to-Winter and Fall-to-Fall retention rates are at or above those of prior years.
- First-term accumulation of 6–11 college credits is up from the past three terms; 12+ credits accumulation is just below last year’s peak.
- For the first time in four years, the percentage of first-time-college students completing math or writing by the end of their first year increased.
- Accumulations of 24+ and 36+ college credits are higher than previous levels.
- The graduation rate increased for the first time in four years, while the transfer rate declined from last year’s record high.
Accessible version of the table
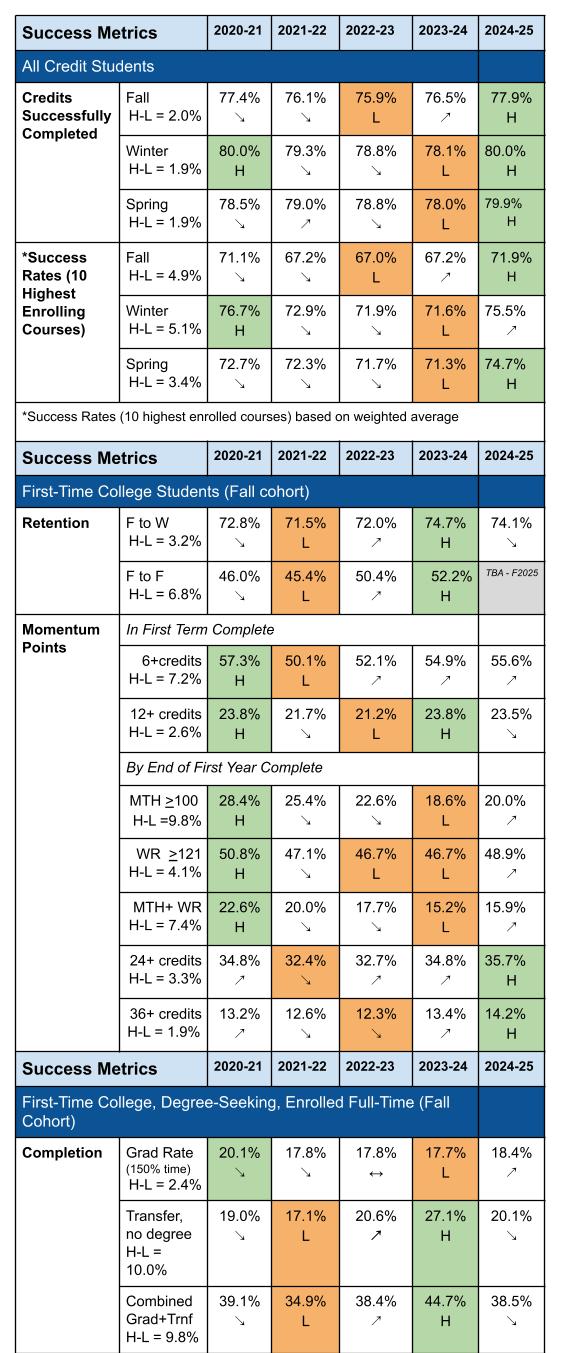
*Time references such as “all previous levels” and “record high” refer to data from the most recent five-year period.
Source: Credits Successfully Completed, Highest Enrolling Course Success Rates, Retention, Momentum Points, and Graduation and Transfer Reports
Updated July 2, 2025