ARGOS Momentum Points Dashboard
Using the “ARGOS: Momentum Points” Dashboard in the ARGOS Advanced Reporting Tool. The ARGOS web viewer may look different and functionality may be expanded or limited. (For example in the web viewer, users can manually manipulate the graph style, but in Advanced ARGOS that functionality is not available.)
This report pulls a population of first time college students (as of the term specified in the dashboard drop down menu on the main page), and calculates what percentage of this group of students completes the following momentum points:
- 6 Credits Earned in their first term of attendance
- 12 Credits Earned in their first term of attendance
- 22 credits earned in their first year of attendance
- 36 credits earned in their first year of attendance
- 45 credits earned in their first year of attendance
- Math 100 or greater completed in their first year of attendance
- Writing 121 or greater completed in their first year of attendance
- Math 100 or greater and Writing 121 or greater completed in their first year of attendance
- Math and Writing Completed includes credits transferred to PCC during the first year of attendance.
- All momentum points include only “successful” final grades for the courses in question: A, B, C, and P.
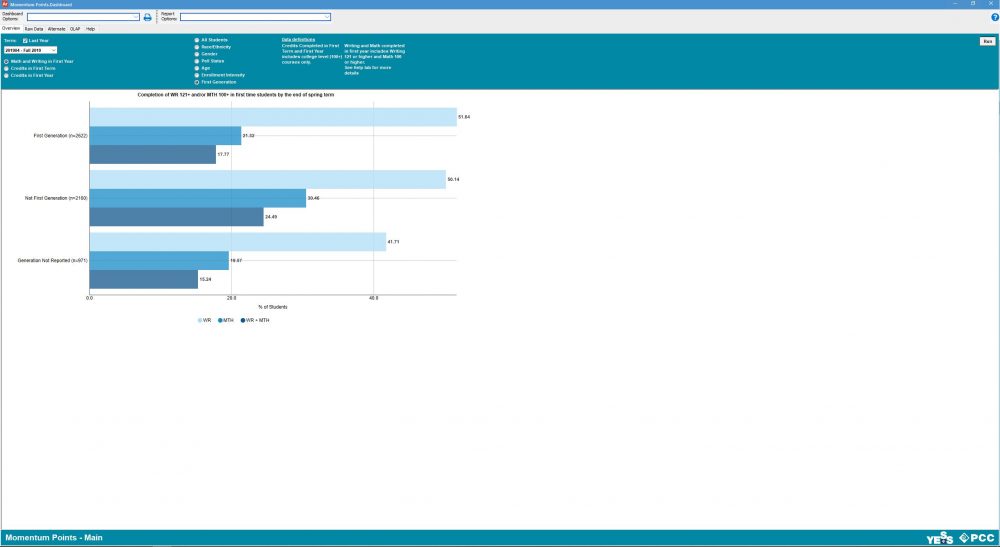
The Overview tab
The Overview or “Main” tab allows you to look at a graph of data, disaggregated by one category from the following:
- All Students
- Race/Ethnicity
- Gender
- Age
- Pell Status
- Enrollment Intensity
- First Generation Status
To see the default settings of all students and last fall, simply click the run button.
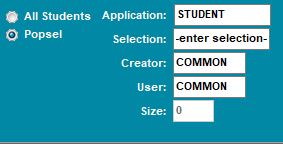
POPSELs
The YESS ARGOS Reports are now compatible with Banner POPSELs. The “All Students” or “Popsel” buttons will appear on the main or overview tabs of ALL Argos YESS Reports.
To use a popsel (population selection) that you or someone else has created and populated with G numbers simply enter the field information as you would in Banner. The most common application is Student. The “Selection” field is the name of the popsel. “Creator” will need the banner username of the person who created the popsel. The “User” field will require the banner username of the person that loaded the popsel, most commonly the creator or your own banner user name. The “Size” field will populate automatically if all other fields have been entered correctly.
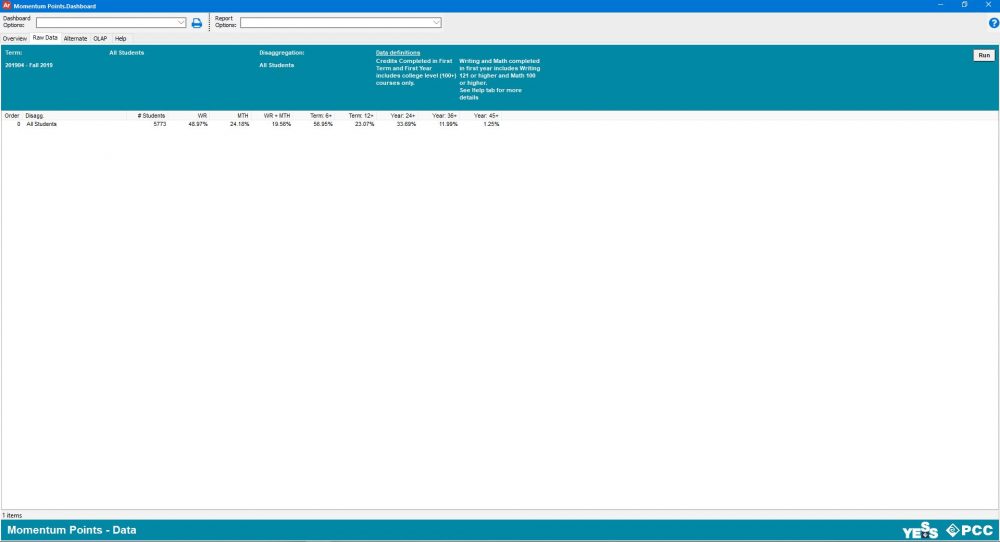
The raw data tab
This tab allows the user to access the non-infographic data based on the current settings in the overview tab. To change the raw data output the user must return to the overview tab, change settings, then return to the raw data tab and push run.
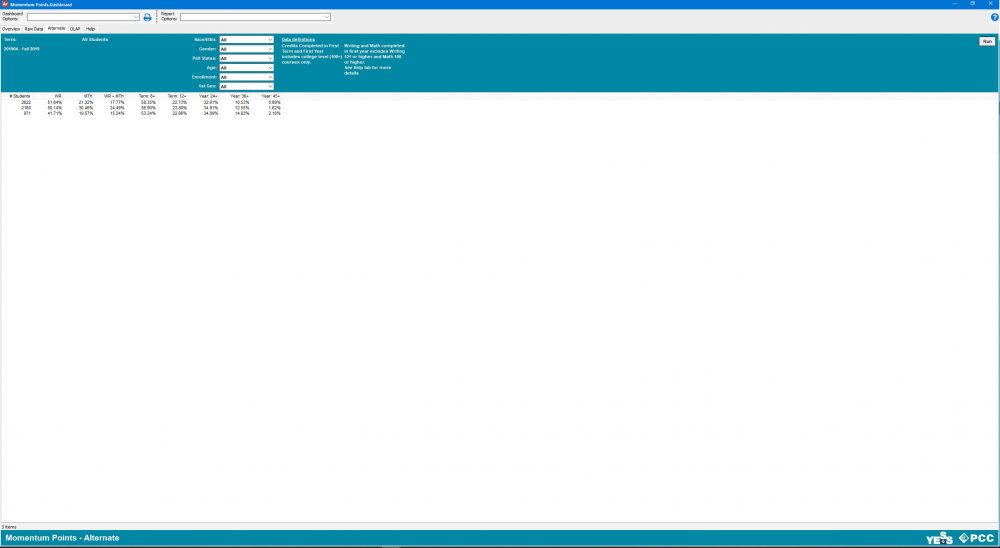
The alternate tab
This tab allows you to select individual values for each disaggregation above, in order to drill down to a subset of students. The term is the only setting that carries over from the overview tab. To change the term simply click on the overview tab and change the term, then click on the alternate tab to work with your newly selected term.
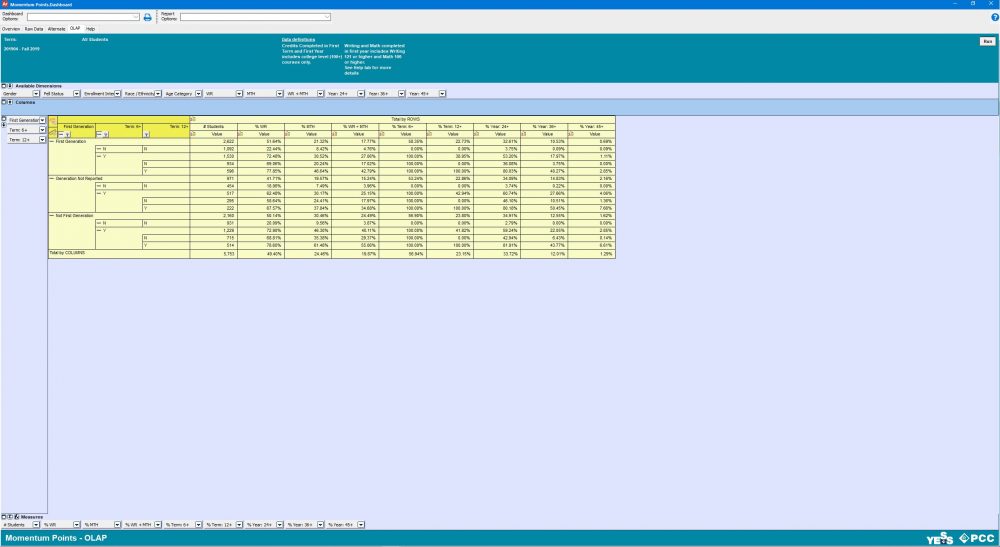
The OLAP tab
This tab provides an OLAP cube, which allows the highest amount of customization of how the data is displayed. The manipulation of OLAP cubes is beyond the scope of this documentation. For training on how to effectively use an OLAP cube please see external documentation or training courses.