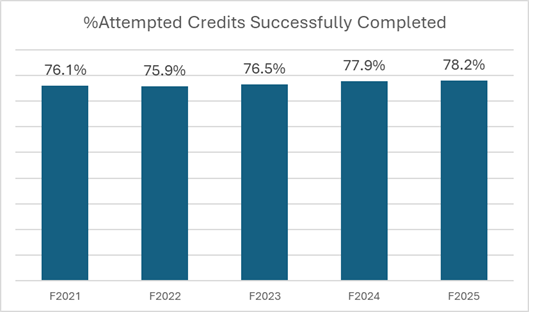
Credits Successfully Completed – Fall
Successful completion of attempted credits propels students toward the achievement of their educational goals. A higher credit completion rate increases the likelihood that students will efficiently progress through their academic pathways, saving both time and financial resources.
Fall 2025 success rates showed a modest increase from the prior year, reaching the highest level of the past five fall terms. This marked a steady improvement since the 75.9% low in Fall 2022.
Equity Gaps
Equity gap refers to any disparity along racial, socioeconomic, gender or other demographic grouping. These gaps lead the college to ask “what processes, policies or practices are in place that create or exacerbate these disparities? ”
| Fall 2025 | Rate Range (low to high) | Equity Gap | *Compared to F2024 |
|---|---|---|---|
| Gender | 77.8% to 78.8% (Male to Female) | 1% point | no change |
| Pell Status | 74.5% to 80.4% (Awarded Pell to No Pell) | 4.9% points | Widened slightly |
| Race/Ethnicity | 69.8%, 69.8% to 81.4% (Black/African American and American Indian/Alaska Native to Asian) | 11.6% points | Narrowed |
| Age | 76.5% to 81.7% (20-24 to 25-29) | 5.2% points | Widened |
| First-Generation | 76.5% to 84.4% (1st Gen to Not 1st Gen) | 7.9% points | Widened slightly |
| Disability | 75.0% to 78.7% (Disability to No Reported Disability) | 3.7% points | Widened |
| Veteran | 77.8% to 78.% (Veteran to Not a Veteran) | 1% point | Narrowed |
| * Interpretation of Comparison: Narrowed = Improved, Widened = Worsened, Slightly indicates difference of < 1 percentage point | |||
Comparisons to Fall 2024
- Fall 2025 success rates and equity gaps varied across student groups.
- The largest gap, by race/ethnicity, narrowed compared to Fall 2024.
- Pell status, age, first-generation status, and disability status equity gaps widened, though some changes were small.
- Differences by gender and veteran status remained minimal, with little to no change from Fall 2024.
Successful Completions by Race/Ethnicity
The table below presents successful credit completion rates by race/ethnicity, along with each group’s five-year range. Four groups reached their highest success rates in Fall 2025, while the remaining four groups’ highest rates were in the previous fall term.
| Race/ethnicity | Completion Rate | 5-Year Range |
|---|---|---|
| American Indian/Alaska Native | 69.8% | 63.5% (F2023) to 72.8% (F2024) |
| Asian | 81.4% | 80.7% (F2022) to 83.9% (F2024) |
| Black/African American | 69.8% | 64.4% (F2021) to 69.8% (F2025) |
| Hispanic or Latino | 73.5% | 69.0% (F2021) to 73.6% (F2024) |
| Native Hawaiian/Pacific Islander | 72.1% | 58.4% (F2023) to 72.1% (F2025) |
| Two or more races | 76.3% | 73.5% (F2021) to 76.9% (F2024) |
| Not Reported | 84.7% | 78.9% (F2022) to 84.7% (F2025) |
| White | 80.9% | 78.9% (F2022) to 80.9% (F2025) |
Notes:
Successful Credit Completion Rate = # of credits completed with grades A, B, C, P divided by total credits attempted (including grades W)
Equity gap = highest credit completion rate – lowest credit completion rate
First-generation = neither parent nor guardian completed a 4-year degree
Data Source: Argos, YESS, Successful Credits Completed, February 2026