Students and Service Area – Race/Ethnicity
For PCC’s 2020-21 enrolled student population, approximately 92% of students selected a race and ethnicity (i.e., Hispanic, or not Hispanic) on the PCC admissions application. A student’s residency status determined membership in the international category. Below are the students’ selections described by mutually exclusive categories and percentages of the total.
| Race/Ethnicity by State Reporting Classification | Percent of 2020-21 PCC Students |
|---|---|
| American Indian or Alaskan Native | 0.6% |
| Asian | 8.1% |
| Black | 4.4% |
| Hispanic | 14.5% |
| International | 1.1% |
| Multi-Racial | 6.3% |
| Pacific Islander | 0.6% |
| White | 56.6% |
| Missing/Not Reported | 8.0% |
| International | 1.1% |
| 50,566 total students | 100% |
| Source: Oregon Community Colleges Data Mart |
A YESS goal of the College is to enroll students from the diverse communities its serves. We evaluate this goal by comparing the composition of the enrolled student population to race and ethnic identities reported by people living in PCC’s service area through the Federal Census.
The Census does not use all of PCC’s race and ethnic categories like not reported and international; therefore, we have taken these categories’ counts out of the overall total of enrolled students and recalculated the remaining categories’ percentages. The graph below displays the revised percentages next to the Census estimates of race and ethnic identities found in PCC’s service area.
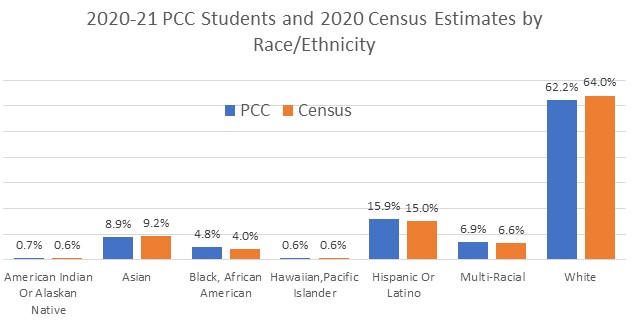
Note: This analysis is based on the 2020 Census data for Washington and Multnomah Counties, which are a combined population estimated to be 1.4 million individuals. These two counties served as a proxy for the PCC service area that also includes portions of Yamhill, Clackamas and Columbia counties.