This content was published: March 9, 2015. Phone numbers, email addresses, and other information may have changed.
Using small data
Posted by Andy Freed
I recently attended the ITC eLearning conference in Las Vegas, NV, and, as always, was excited to learn what my colleagues at different colleges are doing to support their online students and faculty. One session that seemed especially applicable to poach for a Best Practice post was on using in-course analytics, or “small data.”
If you spend any time in higher education thinking about technology, you are probably tired of the word “Analytics,” and I don’t blame you. This craze promises to collect massive amounts of data about student learning, patterns of access, engagement and more with promises to help school administrators do everything from push-button program reviews, predict which students will fail which courses, and how many minutes of that video lecture students are actually watching. Real big business stuff.
But that’s where this notion of small data comes in and shakes off all the pretense and provides a few tangible examples that you can use without dropping big dollars or requiring an advanced data science degree to interpret.
Get practical
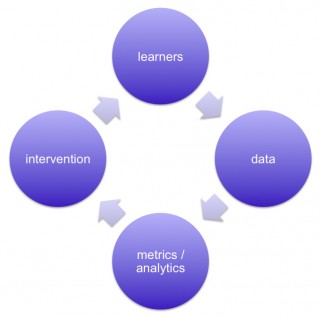
Image Credit: Doug Clow, CC-BY
In this post, I still want to focus on the learning analytics cycle, because no matter the size of your data, you can still use the cycle to adapt your course based on what you observe.
None of this is groundbreaking; most educators already do something like this all the time. You observe something (e.g. looks of confusion from a majority of the class) and you try another method of illustrating that concept. This post will hopefully give you an awareness of some of the tools available to you now to learn about your learners since you won’t be seeing confused faces in your online classes.
Practical examples
D2L provides you with a number of paths to observe student activity so that you can harness the small data learning analytics cycle to inform your teaching practices. My favorite place to start is the User Progress tool, which gives you a quick glance at your class to see student activity. It’s a budget “dashboard” that gives you an overview of login history, grades, discussion posts and more that is somewhat customizable for your course. And it’s a very easy way to spot students who are not engaged in the course.
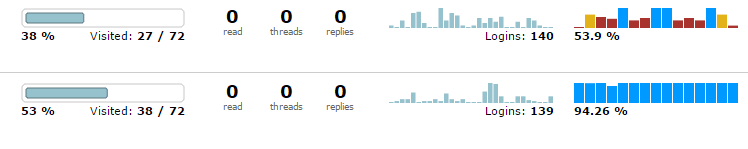
For example, consider these two students. Their login history is relatively similar, but their grade history is quite different. Also, the second students has viewed much more of the content than the first. So what to do with this information? Well, the grade activity and lack of content access might indicate that the student is struggling. The cycle suggest that you apply some intervention. Sometimes that can be as simple as reaching out to the student. Email is great, but sometimes a phone call is warranted. And what do you say? Just check in. Offer information about free online tutoring. Make sure the student knows where they are in the class. And just let them know that you are there and you are interested in their success.
There are lots of practical examples, and this is supposed to be a brief post, so I’ll simply point you to two more examples from our own instructional technology specialists. They provide a great start to knowing more about your students’ activity.
- Melany shows how to use the quiz statistics to evaluate individual quiz questions. You can use this information to find problematic questions or difficult concepts to address in the content.
- Jim looks at Content viewing statistics, which you can see where specific items aren’t getting viewed by students.
There is no end to what you do with this topic, and I’m sure many of you have practical examples of your own. Please share them in the comments. If you aren’t sure how this applies, don’t think big. Think small data and small changes. Those too can have meaningful effects on student learning. If you aren’t finding information about a topic or activity you want to learn about, ask us, we might know if it is available.
More information
The session I attended at eLearning was “Using course analytics to inform teaching, learning and assessment” by Janet Latricia King. She’s offering a webinar on the subject on May 12, 2015. Let me know if you are interested in attending.
About Andy Freed
I'm the Director of Learning Technology & Innovation (LTI!), where I oversee our infrastructure, technical support, and online student services teams. I've been with the College since 2001 and have worked in several positions, from tech... more »

I found this post very useful. I need more help like this, showing exactly how I can go in and track a student’s progress. The example was very interesting as the successful student had two fewer logins, but was still ahead of the game in terms of grades.
Right, we cannot see the blank looks in an online classroom, but those looks are out there in the form of blank data, perhaps.
Thank you.
I am encouraged by the the example of calling a student. I have found email interventions to be a “shot in the dark,” not knowing if the student even reads my intervention. I remember early in the development of FERPA guidelines that making phone calls was discouraged, but I appreciate Andy suggesting we do so. I am curious if we have or could have whole-class texting, or selected group texting that students could sign up for so I could offer students the option to receive automatic “Remember to do your homework” text reminders.